- By Lanner
- In Customer Stories
- Posted 08/01/2003
Introduction
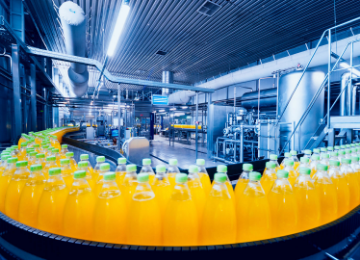
A simulation study was conducted on a bottle packaging line for GlaxoSmithKline, formerly Glaxo Wellcome, at their Zebulon, North Carolina manufacturing facility. The study had three objectives:
- increase the overall productivity of the equipment
- alleviate bottlenecks in the production process
- decrease equipment downtime.
Glaxo used WITNESS to develop the models in this study.
Background
In January 2000, Glaxo Wellcome merged with SmithKline Beecham to form GlaxoSmithKline (GSK), a world leading research-based pharmaceutical company with a seven per cent of the global pharmaceutical market. GSK had 2000 sales of £19 billion and profit before tax of £5.5 billion. Pharmaceutical sales accounted for £16 billion, 85 per cent of the total.
The following assumptions were made for the study. The impact of labour would not be explored since labour composes a small portion of the overall production cost. The available shift time was 600 minutes (a ten-hour day); preventative maintenance would not be included since this is done on off-shifts when the equipment is not in production. Downtime data used in the models would be from a 40-day sample, and inter-equipment conveyors would experience no downtime.
Model Development and Analysis
Once these assumptions had been determined, the data collection was started. Downtime data is reported on a daily basis by each machine operator using a descriptive downtime code. This data is then entered into a computerized database for each machine by specific codes. Printouts of the data were manipulated into a usable form for each machine included in the simulation. Machine cycle time data was also needed before the models could be built. Data for this function was collected by videotape, direct observation, and the budget standards developed by the Industrial Engineering Department.
With the data collected, it was time to build the basic model. Using cycle times (200 bottles per minute) based on the budget standard and individual machine downtime data, a basic model was developed and run until a full lot (177,333 bottles) was completed. The model was then de-bugged and run again to check for accuracy. Finally, a printout of data collected during the execution of the model was obtained. Once the base model was verified for accuracy, it was used to develop three other models. All models were based on the same lot size. The only variable in the next three models was cycle time.
The second model was built to simulate the actual operating conditions of the line. The third model explored the possibility of completing a full lot in one shift (600 minutes). Finally, a predictive model was developed. This model was driven by the maximum cycle time of the rate-limiting machine (275 bpm).
One of the important factors for this line was machine utilisation. Output reports from each model gave the percentage of time each machine was busy, blocked, idle, down, or in setup. The higher the overall busy time on the line, the greater line productivity. This utilisation data can also be used to uncover bottlenecks on the line.
Analysis of the equipment utilisation data for the standard model showed high rates of blockage at the bottle cleaner and tablet filler, and the nearly straight line of busy time for the entire line. When equipment utilisation for the actual model was compared to the standard model, a wide variation of busy time between equipment existed. Much higher blocked time could be seen on both the bottle cleaner and tablet filler. Busy time had dropped nearly 20 percent on some pieces of equipment. The one shift model indicated that although blocked time was increased on the bottle cleaner and tablet filler, the 10 percent loss of busy time from the standard model was made up by the increase in throughput and decrease in processing time. The predictive model showed a lesser decrease in busy and blocked time (about five percent overall), but a much higher productivity than in the standard model.
Another analysis looked at the blocked time on critical pieces of equipment. Blocked time for the bottle cleaner, tablet filler and bottle capper was compared for each of the four models. It should be noted that each piece of equipment showed the highest rate of blockage in the actual model.
Recommendations
The second recommendation addressed the lunch/break policy. Whenever operators went on lunch or break, the line would be shut down. This prevented achievement of the 600 minute per shift run time. It was suggested that breaks be staggered to maximise uptime by keeping equipment functional throughout the shift.
The final recommendation restricted line speed adjustments to a designated category of personnel. The normal operating procedure had allowed any operator to increase or decrease the speed on any piece of equipment.
Results
Nearly nine months after the implementation of these recommendations, line productivity has increased by 15 percent. Downtime had been reduced because speeds have remained constant, with designated maintenance personnel changing equipment speeds. Following review of the data presented in this study, management chose to increase the functional line speed to 230 bpm from 200 bpm, thereby increasing the amount of product generated. Finally, instead of staggering lunch and breaks, a relief team of operators is now utilised to run the line without interruption, preventing the loss of 60 minutes per shift of equipment run time.
The use of WITNESS in this case was instrumental in allowing management to gain a clear understanding of the impact of speed and equipment variables on net throughput. The ability to present the mathematical under structure of the models in a graphically animated manner was critical to communication in a setting such as this, where people of varying backgrounds and skills need to grasp the concepts for accurate decision making.